by Isabella E. Wagner
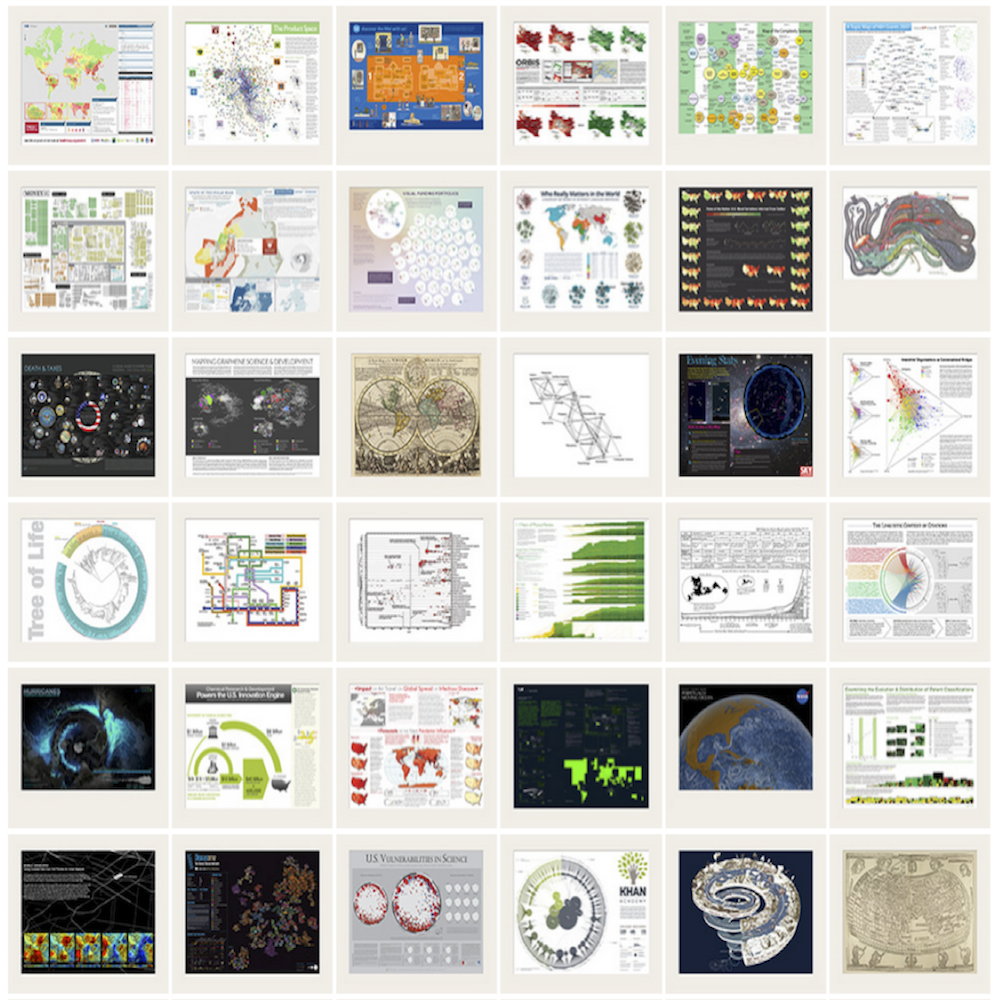
“Everything has become visual”, as one of my interviewees put it, and practices in the field of scientometrics are no exception. Scientometricians study dynamics in science itself with the help of quantitative methods. Studying visualisations in this specific discipline during my field research at the 2013 conference of the International Society of Scientometrics and Informetrics (ISSI conference 2013) I was thrilled by the extensive use of abstract data and its representation in colourful graphs, network diagrams and even interactive visualisations. Some of the images were cartograms or data layers on geographic maps. Even in cases where no geographic coordinates were integrated sometimes the term science map was used metaphorically, suggesting that abstract data from various scientific fields and statistical data about dynamics in science can be mapped to then guide its audience through some extract of the world out there.